Core Web Vitals are a handful of specific signals that Google uses to size up a website's real-world user experience. Think of them as a report card for your site's health, focusing on three make-or-break areas: loading speed, responsiveness, and visual stability.
Why Core Web Vitals Are Your Website's First Impression

When a potential customer lands on your website, that initial interaction is everything. It's the digital equivalent of a firm handshake or a clean, welcoming storefront. This crucial first impression is precisely what Core Web Vitals are designed to measure.
A slow-loading page, a layout that jumps around, or buttons that don't respond can send visitors clicking away in frustration—often straight to a competitor. In fact, a delay of just a few seconds can dramatically increase the odds that a user will simply give up and leave. For instance, a local Kansas City boutique with a slow-loading homepage might lose a customer to a faster competitor before they even see the first product.
The Three Pillars of User Experience
Google's framework boils down this complex interaction into three core metrics. Each one acts as a specific test for your website’s performance, all from a user's point of view.
Here's a quick look at what they are and what they measure.
Core Web Vitals at a Glance
| Metric | What It Measures | Good Score |
|---|---|---|
| Largest Contentful Paint (LCP) | Loading Performance: How fast the main content appears. | Under 2.5 seconds |
| Interaction to Next Paint (INP) | Responsiveness: How quickly the page reacts to a click or tap. | Under 200 milliseconds |
| Cumulative Layout Shift (CLS) | Visual Stability: How much the layout shifts around as it loads. | 0.1 or lower |
Let’s break down what each of these really means.
What Do These Metrics Actually Mean?
- Largest Contentful Paint (LCP): This is all about loading performance. It asks: how long does it take for the most significant piece of content—like a hero image or a big block of text—to become visible on the screen? A fast LCP makes a site feel fast.
- Interaction to Next Paint (INP): This one measures responsiveness. It asks: when a user clicks a button or taps the screen, how quickly does the page react and show a visual response? A good INP score means your site feels snappy and interactive, not sluggish.
- Cumulative Layout Shift (CLS): Finally, this metric measures visual stability. It asks: do elements on the page unexpectedly jump around as it loads, potentially causing users to click on the wrong thing by accident? A low CLS score means the layout is stable and predictable.
Getting these three metrics right is a non-negotiable for modern SEO. They are a direct ranking signal, meaning strong scores can help improve your visibility on Google, while poor scores can hold you back.
This focus on real-world data is what makes these metrics so important. Google rolled out Core Web Vitals in May 2020 to prioritize genuine user experience over simple, on-paper specs.
They measure these metrics at the 75th percentile, meaning that for your site to get a 'good' score, at least three out of every four visitors must have an experience that meets the threshold. You can read the full analysis about how these thresholds were defined on web.dev. This data-driven approach directly connects technical performance to the actual experience your visitors have, making it a powerful tool for improving your site's effectiveness and ensuring a stellar website user experience design.
Decoding Each Core Web Vital with Real-World Analogies
To really get what Core Web Vitals are all about, you have to stop thinking like a machine and start thinking like a person. Forget the technical jargon for a minute. Each of these metrics represents a specific moment in your visitor's experience, and once you understand those moments, fixing them becomes a whole lot easier.
Let's break each one down with an analogy you can actually picture.
Largest Contentful Paint (LCP) The Main Event Arriving
Imagine walking into a room for the first time. LCP is the time it takes for the most important thing in that room—the sofa, the big-screen TV, the dining table—to appear. It's the one element that tells you what the room is for. On a website, this is your hero image, your main headline, or the video right at the top.
A fast LCP feels like a warm welcome. It tells the user, "Yep, you're in the right place." But an LCP over 2.5 seconds feels like walking into an empty room and awkwardly waiting for the furniture to show up. This lag is almost always caused by huge, unoptimized media files that take forever to download.
Practical Example: A Kansas City restaurant's website has a beautiful, full-screen photo of their signature dish as the main LCP element. If that photo is a 5MB file, it will take ages to load, especially on mobile. The visitor will just see a blank space, get bored, and search for another restaurant.
The number one culprit behind a bad LCP score? Giant images. If your main banner is a massive file, the browser has to sweat to download and show it, all while your visitor's patience is wearing thin. For a deep dive into crushing this problem, our guide on how to optimize images for web has all the actionable steps you need.
Interaction to Next Paint (INP) The Responsive Conversation
Think of INP as a digital conversation. When you ask someone a question, you expect a response pretty quickly, right? On a website, INP measures how long it takes for something to happen visually after you click a button, open a menu, or start typing in a form.
A good INP score (under 200 milliseconds) feels like a snappy, natural conversation. You click "Add to Cart," and boom, the item is in your cart. A bad INP score is like asking a question and getting a long, uncomfortable silence. You're left wondering if your click even went through. That sluggishness is usually caused by heavy JavaScript running in the background, basically tying up the browser's "phone line."
Practical Example: A user on a local service provider's site tries to open the "Services" dropdown menu. A poor INP means they click, and nothing happens for half a second. They might click again, thinking it didn't register, leading to a frustrating, glitchy experience.
Cumulative Layout Shift (CLS) The Unpredictable Floor
Cumulative Layout Shift is all about visual stability. Picture this: you're about to step onto an escalator, but right as you lift your foot, the step suddenly lurches sideways. It's jarring, confusing, and you'll probably stumble. That's CLS in a nutshell.
On a webpage, it’s that infuriating moment when you go to click a button, but just before your cursor lands, an ad loads above it, shoving the entire page down and making you click on something else entirely.
A low CLS score (0.1 or less) is absolutely critical for building user trust. It’s a promise that the layout is stable and predictable, creating a smooth experience instead of a frustrating one.
The most common offenders causing CLS are:
- Images without dimensions: If you don't tell the browser how much space to save for an image, it just plops it in whenever it finishes loading, pushing everything else out of the way.
- Ads and embeds: Banners, videos, or even social media widgets that pop in after the rest of the page is visible are notorious for causing massive, unexpected shifts.
- Dynamically injected content: Those "Subscribe to our newsletter!" bars that suddenly appear at the top of the page without warning are a classic example.
Alright, let's get into the nitty-gritty. Understanding what Core Web Vitals are is one thing, but the real power comes from seeing how your own website stacks up. To do that, you need the right tools.
Luckily, Google gives us a couple of fantastic, free resources that every single site owner should have in their back pocket. They give you the raw data needed to turn abstract ideas like LCP and CLS into a concrete to-do list.
The two heavy hitters here are PageSpeed Insights and Google Search Console. Let’s break down how to use them.
Field Data vs. Lab Data: What’s the Difference?
When you plug a URL into PageSpeed Insights, you’ll see two kinds of data: Field Data and Lab Data. It is absolutely critical to know which is which.
-
Lab Data is a simulation. Think of it as a performance test run in a sterile, perfect laboratory. It’s collected in a controlled environment with a specific device and network connection, which is great for debugging and testing changes you just made. But—and this is a big but—it doesn’t reflect what your actual users are experiencing out in the wild.
-
Field Data comes from real people. This is the good stuff, collected from actual Chrome users who’ve opted-in to share their browsing data. This is compiled into the Chrome User Experience Report (CrUX), and it's the "real-world" data Google actually uses for ranking.
Field Data is your ultimate source of truth. While lab tests are super helpful for diagnostics, your primary goal should always be to improve the scores that your real visitors are generating.
Using Google Search Console for the 30,000-Foot View
PageSpeed Insights is perfect for zeroing in on a single page, but Google Search Console gives you the site-wide overview. It's your command center for performance. If you haven't set it up yet, it's a non-negotiable tool for any serious website owner—you can follow our guide on how to set up Google Search Console to get started.
Inside Search Console, the Core Web Vitals report is where the magic happens. It identifies performance issues at scale, grouping pages with similar problems so you can see which parts of your site are on fire and need the most urgent attention.
This diagram helps visualize how each metric fits into the user's journey.
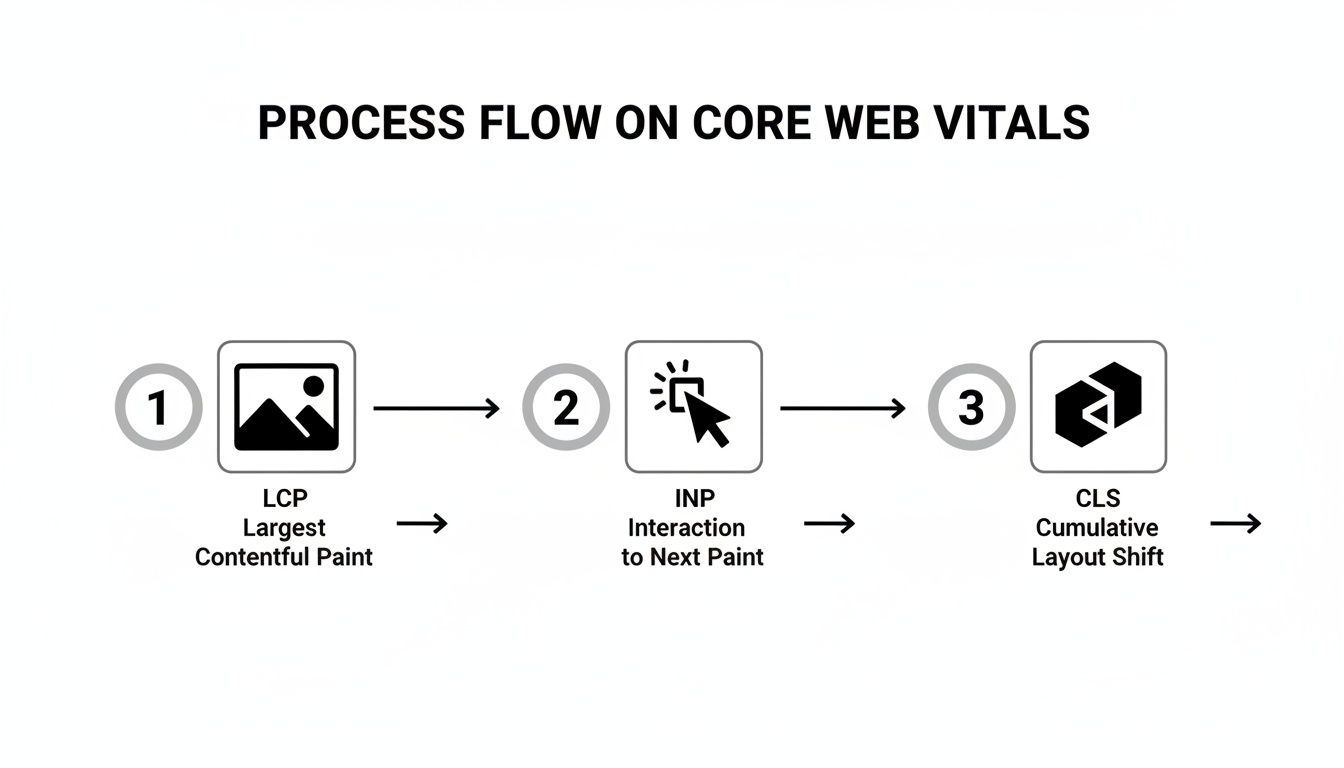
As you can see, each vital—LCP, INP, and CLS—is designed to capture a unique phase of the experience, from that initial load to the final interactive stability.
The Search Console report takes all that real-world CrUX data from the last 28 days and buckets your URLs into three simple categories: 'Poor,' 'Needs Improvement,' or 'Good.'
Here’s the important part: it flags a group of pages based on its worst-performing metric. So even if your LCP and INP scores are 'Good,' a 'Poor' CLS score will drag the entire group into the 'Poor' category. This is actually a good thing, as it tells you exactly where to focus your energy first.
This dashboard view makes it easy to see performance trends over time. You can track whether your fixes are actually making a dent and if your mobile or desktop experience is getting better or worse.
The Bottom-Line Impact on SEO and Business Growth
Knowing what Core Web Vitals are is one thing, but connecting those metrics to real dollars and cents is where it all clicks. These aren't just abstract scores for developers to chase; they draw a straight line to your company's bottom line, influencing everything from how you show up in search to whether a customer decides to stick around.
At the end of the day, a fantastic user experience is a powerful business asset. When a site just works—when it's fast, responsive, and stable—visitors stay longer, dig deeper into your content, and are far more likely to become customers. This isn't just a theory; you can see it in the data.
From Page Experience to Profit
Back in 2021, Google made it official: Core Web Vitals became a key piece of its Page Experience ranking signal. This means your LCP, INP, and CLS scores are a direct factor in how visible your website is in search results. A great score can give you a real competitive edge, especially if others in your space are running slow, clunky sites.
For a local business, the impact can be dramatic. Picture a Kansas City e-commerce shop that manages to cut its LCP time from 4 seconds down to 2. By getting its main product shots to load faster, it could see a direct lift in sales simply because shoppers aren't sitting there tapping their fingers, waiting.
Or think about a local contractor whose mobile site has a terrible CLS score. If visitors keep accidentally clicking the wrong button because the layout jumps around, they're going to get frustrated and leave. Fix those layout shifts, and suddenly the bounce rate plummets while appointment bookings climb.
Investing in Core Web Vitals is not a technical expense—it’s an investment in user satisfaction that pays dividends through higher engagement, better conversions, and sustained organic growth.
The Financial Cost of Poor Performance
The damage from a bad user experience isn't just theoretical; you can actually quantify it, and the numbers are often startling. Study after study shows a direct link between how fast your site performs and how much money it makes.
- Higher Bounce Rates: More than 50% of users will give up and leave a page if it takes longer than 3 seconds to load. Every one of those visitors is a lost opportunity.
- Lower Conversion Rates: Even tiny improvements can have an outsized impact. Shaving just 0.1 seconds off your site's speed has been shown to boost conversion rates by as much as 8%.
- Reduced Engagement: A sluggish, unpredictable website chips away at trust. It discourages people from coming back, which poisons long-term customer relationships.
Ultimately, a fast, stable, and responsive website is the foundation for capturing and keeping customers online. When you prioritize these metrics, you're directly supporting your efforts to increase what is organic search traffic and build a more powerful digital presence. When users have a good experience, they'll reward you with their business. It's as simple as that.
Actionable Fixes for Common Core Web Vitals Issues

Alright, so you know your scores. That’s the easy part. The real work is turning those red and orange warnings into a sea of green—because that’s what actually moves the needle.
Fixing Core Web Vitals often boils down to a handful of high-impact changes that make a world of difference for your users. Let's break down the most common culprits and how to deal with them, one metric at a time.
Improving Largest Contentful Paint (LCP)
A poor LCP score almost always means your main content is taking way too long to show up. The usual suspect? A massive image, a video, or a big block of text sitting right at the top of your page.
Your one and only goal here is to make that "largest" piece of content appear faster.
- Optimize and Compress Your Images: This is the big one. Large, uncompressed images are the number one killer of LCP. Actionable Insight: Use a tool like Squoosh or an automated WordPress plugin like Smush to convert your JPEGs and PNGs to the modern WebP format. Aim for file sizes under 150KB for large hero images.
- Implement Lazy Loading: This clever trick tells the browser to only load the images a user can actually see on their screen. Anything "below the fold" will only load as the user scrolls down, freeing up precious resources to render that critical above-the-fold content first.
- Upgrade Your Hosting: A slow server response time creates a bottleneck that delays everything else. Investing in quality hosting, especially with servers located near your audience, can give you a massive LCP boost right out of the gate. For a Kansas City business, choosing a host with a data center in the central U.S. can shave critical milliseconds off your server response time.
Boosting Interaction to Next Paint (INP)
A bad INP score is what makes your site feel slow and clunky. It's that annoying delay between clicking a button and seeing something happen. This is almost always caused by heavy JavaScript tying up the browser's main thread, making it too busy to respond to user input.
Your goal is to clear the browser's main "thread" so it can immediately react to user input. Breaking up long-running tasks is the key to creating a snappy, interactive experience.
You can get this done by:
- Deferring Non-Critical JavaScript: Not every script needs to run the second a page loads. Actionable Insight: Use the
deferorasyncattribute on your<script>tags for non-essential scripts like social sharing buttons or analytics. This tells the browser to load them without holding up the rest of the page. - Breaking Up Long Tasks: Complex scripts can hijack the browser for frustratingly long periods. A developer can chop these into smaller chunks, giving the browser a chance to breathe—and respond to user clicks—in between tasks.
Fixing Cumulative Layout Shift (CLS)
CLS is arguably the most infuriating issue for users, but it's often the simplest to fix. Those unexpected, jumpy layout shifts almost always happen for one reason: the browser doesn't know how much space to save for an element before it loads.
The solution is wonderfully simple: always specify dimensions for your media.
Actionable Insight: In your HTML, always include width and height attributes on your <img> and <iframe> tags, like <img src="image.jpg" width="600" height="400">. Even if you use CSS to make the image responsive, these attributes allow the browser to reserve the correct aspect ratio, preventing content from jumping around as the image loads.
These thresholds aren't just random numbers; they're based on real-world data from millions of users. For instance, the 'good' INP threshold of 200ms was chosen because 56% of mobile origins already hit that mark, making it an ambitious but totally achievable target for developers.
If you're on WordPress, many of these fixes can be handled with plugins that take care of caching and image optimization. We cover this in detail in our guide on how to speed up a WordPress site.
Core Web Vitals Improvement Checklist
To make things even clearer, here's a quick-reference checklist that breaks down the common causes and actionable fixes for each metric. Think of this as your cheat sheet for your next technical audit.
| Metric | Common Cause | Actionable Fix |
|---|---|---|
| LCP | Slow server, large uncompressed images, render-blocking scripts. | Upgrade hosting, compress images to WebP, defer non-critical CSS/JS. |
| INP | Heavy JavaScript execution, long-running scripts, third-party code. | Defer or async scripts, break up long tasks, minimize third-party scripts. |
| CLS | Images or ads without dimensions, dynamically injected content. | Specify width and height on all media, reserve space for ads. |
Keep this table handy as you work through your site. By systematically addressing these core issues, you can create a noticeably faster and more stable experience for every visitor.
Frequently Asked Questions About Core Web Vitals
Even with a solid handle on the metrics, a few common questions always seem to pop up. Think of this as the troubleshooting section—quick, clear answers to the things that can trip you up as you start optimizing.
Let's clear up any lingering confusion.
Why Are My Mobile and Desktop Scores So Different?
It’s incredibly common to see a stellar score on desktop and a dismal one on mobile. This isn't a bug; it's because the testing conditions are worlds apart.
Mobile users are often dealing with slower cellular networks and less powerful devices, which magnifies every single performance flaw. Desktops, on the other hand, usually have the luxury of fast Wi-Fi and beefy processors. Since Google uses mobile-first indexing, your mobile scores are the ones that truly matter for your rankings. Pay attention to them first.
How Often Should I Check My Core Web Vitals?
You definitely don't need to check them every day. The field data in your Google Search Console report is based on a rolling 28-day average, so the fixes you push today won't fully show up for about a month.
A good rhythm is to check your scores weekly or bi-weekly to spot any new trends. The only exception is right after a major site update or redesign—then, you’ll want to check more frequently to make sure you haven't accidentally broken something.
Think of it less like a real-time dashboard and more like a monthly health report. Consistent monitoring helps you spot long-term trends and validate that your fixes are actually working.
Do Passing Scores Guarantee a Top Ranking?
No, and this is a big one. Passing Core Web Vitals is not a golden ticket to the #1 spot. While they are a confirmed ranking signal inside the larger Page Experience update, they're just one piece of a very large puzzle. Google looks at over 200 signals when ranking a page.
High-quality, relevant content and a strong backlink profile are still the kings of the SEO world. However, in a tight race where you and a competitor both have fantastic content, a superior page experience can absolutely be the tiebreaker that pushes you ahead. Think of it as a foundational requirement, not a magic bullet.
At Website Services-Kansas City, we turn these complex metrics into simple, actionable strategies that drive real business growth. If you're ready to improve your user experience and boost your search rankings, let's talk. Visit us at https://websiteservices.io to schedule your comprehensive SEO audit today.