To figure out what’s working on your website (and what isn’t), you need a way to track your traffic. This usually means using a tool like Google Analytics, which collects data on who visits your site, how they got there, and what they do once they arrive.
It all starts by adding a small snippet of tracking code to your website. Once that's in place, it starts monitoring every single user session, giving you the raw data you need to make smarter business decisions.
Why Tracking Website Traffic Is Your Secret Weapon

Before we get into the nuts and bolts of setting things up, let's talk about why this data is so incredibly valuable. Tracking website traffic isn't just about watching numbers go up. It's about turning that data into a clear roadmap for growing your business.
This information is a direct line to your audience, turning vague assumptions into a rock-solid strategy.
Imagine you run an e-commerce shop and discover that a whopping 60% of your sales trace directly back to your Instagram ad campaigns. That single insight is pure gold. Actionable Insight: You can immediately reallocate your marketing budget, doubling down on Instagram and pausing underperforming campaigns on other platforms to maximize your return on investment.
Turning Data Into Smarter Decisions
Or maybe you’re a blogger. You might notice your "Beginner's Guide to SEO" consistently pulls in 3,000 unique visitors per month, far more than any other article. This isn't just a vanity metric; it’s your audience telling you exactly what they want more of.
Practical Example: This data tells you to create a content cluster around that topic. Your next articles could be "5 Common SEO Mistakes for Beginners" or "How to Choose Keywords for Your First Blog Post," directly serving the audience you know you already have.
When you get down to it, tracking traffic lets you:
- Pinpoint Your Best Marketing Channels: See exactly where your most valuable visitors are coming from, whether it's organic search, social media, or your email list.
- Understand Audience Behavior: Figure out which pages keep users hooked and which ones make them leave. This is your key to improving the user experience.
- Optimize for Conversions: Learn what content actually drives sales or sign-ups, allowing you to fine-tune your sales funnel.
By consistently analyzing your traffic, you stop hoping for growth and start engineering it. Every data point is a clue that helps you make smarter, more confident, and ultimately more profitable decisions.
Essential Traffic Metrics and What They Really Mean
When you first open up an analytics tool, you're hit with a wall of numbers and terms. It can be overwhelming. This table breaks down the most important metrics, what they measure, and a practical example of how to use them.
| Metric | What It Measures | Actionable Insight & Example |
|---|---|---|
| Users | The number of unique individuals who visited your site. | Track this monthly to gauge overall audience growth. An increase from 1,000 to 1,500 users means your marketing is expanding your reach. |
| Sessions | The total number of visits to your site. One user can have multiple sessions. | A high sessions-per-user ratio indicates loyalty. If you have 1,000 users but 2,500 sessions, it means people are returning. |
| Pageviews | The total number of pages viewed on your website. | Identify your most popular content. If a specific blog post has 10,000 pageviews, promote it on social media and link to it from other articles. |
| Bounce Rate | The percentage of visitors who leave after viewing only one page. | A high bounce rate (e.g., 85%) on a key landing page signals a problem. Check if the page content matches the ad that brought them there. |
| Session Duration | The average amount of time a user spends on your site during a single visit. | Longer durations suggest engagement. If your average session duration is over 3 minutes, your content is likely resonating well. |
| Traffic Source | Where your visitors came from (e.g., Organic Search, Social, Referral). | Tells you which channels to invest in. If "Organic Search" drives 70% of your traffic, SEO efforts should be a top priority. |
Think of these metrics as the vital signs of your website. By keeping a close eye on them, you can diagnose problems early, spot opportunities for improvement, and make sure your online presence is healthy and growing.
Choosing Your Analytics Toolkit

With a sea of analytics tools out there, picking the right one can feel like a chore. The secret isn't chasing the platform with the most bells and whistles; it's about matching the tool’s strengths to your actual business goals. This choice is the foundation for how you'll track and understand your website traffic.
For the vast majority of people, Google Analytics 4 (GA4) is the undisputed king. It’s free, ridiculously powerful, and plugs right into other essential Google products like Search Console and Google Ads. It gives you a deep well of data on everything from user behavior and acquisition channels to conversions.
But GA4 isn't the only game in town. Depending on what you need to accomplish, looking at some alternatives can unlock some seriously unique insights.
Beyond the Standard Analytics Platform
Sometimes, you need a specialized tool for a specific job. This is where niche platforms really shine, helping you answer questions that a standard analytics package might not be able to.
-
For Visual Behavior Analysis: Check out Microsoft Clarity. This completely free tool gives you heatmaps and session recordings. Practical Example: If you see a high cart abandonment rate, a Clarity recording might show you that users are repeatedly clicking a non-functional button on your checkout page, revealing a bug you need to fix immediately.
-
For Total Data Privacy Control: If data ownership and privacy are your absolute top priorities, Matomo is an incredible alternative. It's an open-source platform that you can host on your own server, giving you 100% control over your website's data.
To help you decide, here's a quick rundown of some of the top players in the website traffic analysis space.
Comparing Top Website Traffic Analysis Tools
This side-by-side comparison of leading website traffic trackers will help you select the best platform for your specific needs and budget.
| Tool | Best For | Key Feature | Pricing Model |
|---|---|---|---|
| Google Analytics 4 | All-around traffic and behavior analysis for most businesses. | Deep integration with the Google ecosystem (Ads, Search Console). | Free |
| Microsoft Clarity | Visualizing user behavior to improve UX and conversion rates. | Heatmaps and live session recordings. | Free |
| Matomo | Businesses with strict data privacy and ownership requirements. | Self-hosted, open-source platform for full data control. | Freemium (Cloud) / Paid (On-Premise) |
| Plausible Analytics | Privacy-conscious users looking for simple, lightweight analytics. | Cookie-free tracking and a simple, one-page dashboard. | Paid (Subscription) |
Each of these tools offers a different lens through which to view your website's performance. The key is to pick the one—or combination of tools—that gives you the data you need without unnecessary complexity.
Making the Right Choice for Your Business
Ultimately, choosing your tool comes down to your main objective. For a new blog, GA4 is perfect for understanding audience growth and which content is resonating. For a complex service-based website, pairing GA4 with Clarity’s session recordings gives you both the hard numbers and the qualitative "why" behind them.
You can learn more about how analytics fits into a bigger growth plan with our resources on search engine optimization.
The best analytics setup isn't just one platform. It's the right combination of tools that gives you the clearest, most actionable picture of your audience. Start with a solid foundation like GA4, then layer on specialized tools as your questions get more specific.
Getting Started with Google Analytics 4
If you're serious about understanding who visits your website and what they do when they get there, your first move should be setting up Google Analytics 4. It’s the industry standard for a reason—it offers an incredible amount of data for free, making it the perfect place to start.
Don't let the name intimidate you; getting it running is more straightforward than it sounds. The first step is to create a new GA4 "property" for your website. Think of this as a dedicated folder where Google will store all your traffic data. Once that's done, Google gives you a unique tracking code, sometimes called a Measurement ID or a Global Site Tag (gtag.js).
This code is the key to everything.
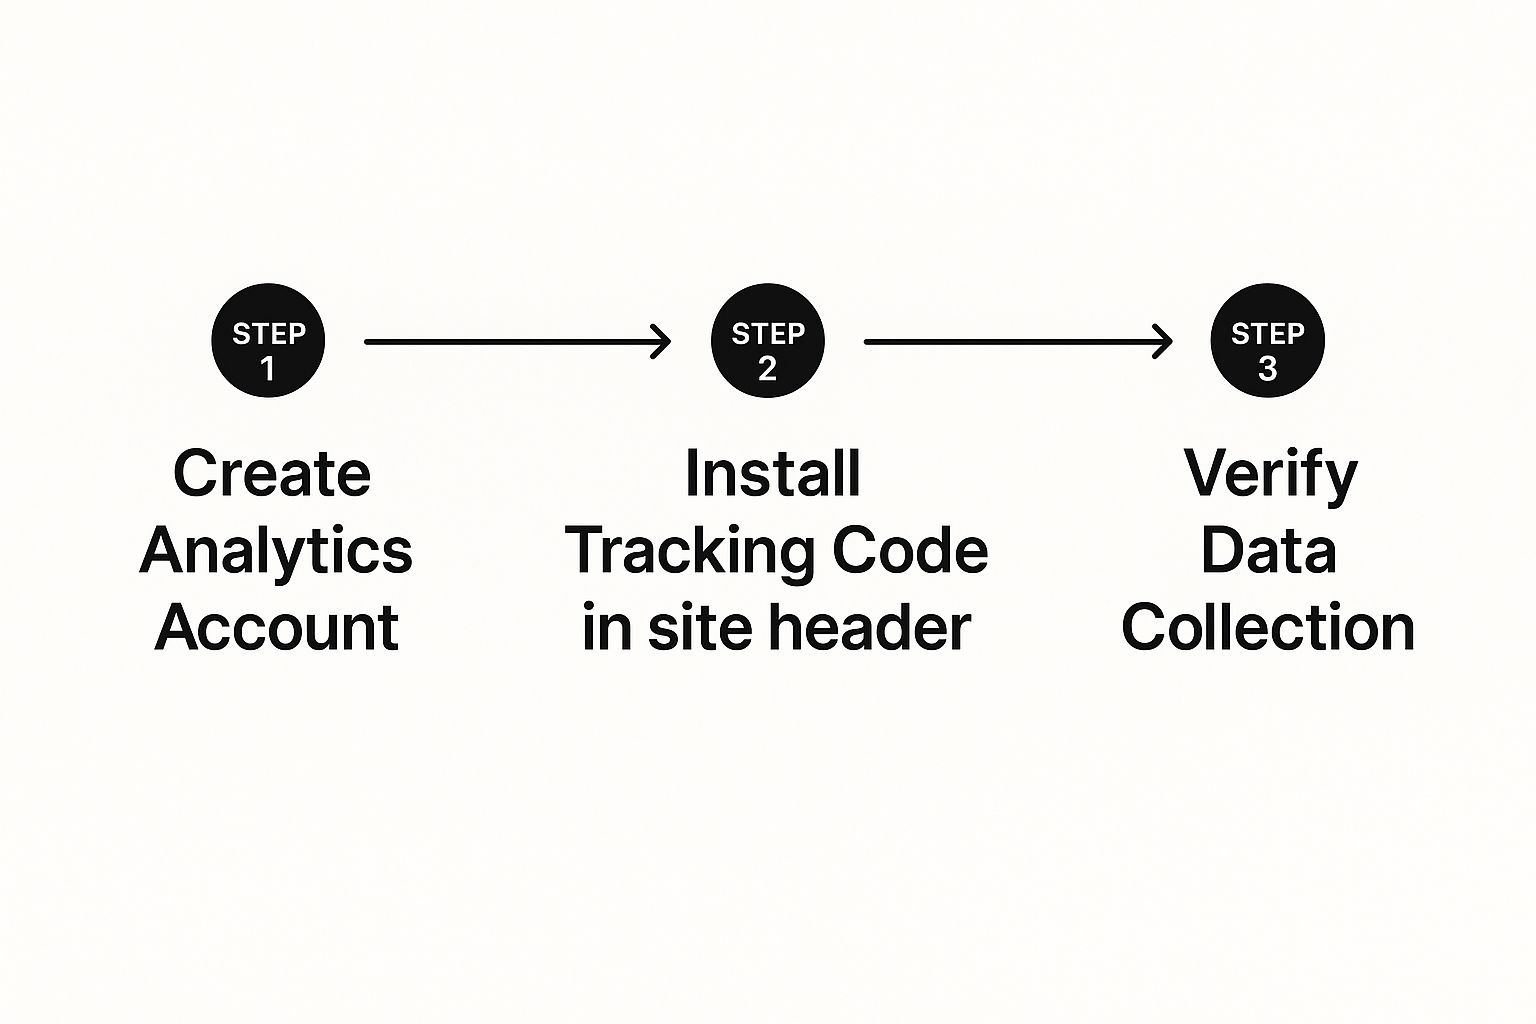
As the visual shows, the path is simple: create the account, install the code on your site, and then make sure the data is actually coming through.
Getting the Tracking Code on Your Site
With your tracking code in hand, you need to add it to your website. This little snippet of code is what allows Google to start logging visits on every single page. You've got a couple of solid options for this.
- Direct Installation: You can just copy the code snippet and paste it directly into the
<head>section of your website’s HTML. This is a quick and dirty method that works great if you're comfortable making small code edits. For many businesses, combining this with a professional approach to WordPress development and SEO makes for a seamless setup right from the start. - Using Google Tag Manager: For more control and flexibility down the road, I highly recommend using Google Tag Manager (GTM). Practical Example: With GTM, if you later decide to add a Facebook Pixel or a LinkedIn Insight Tag, you can do it within the GTM interface in minutes without ever touching your website's code again.
Once the code is in place, you absolutely have to verify it’s working. The easiest way is to use the "Realtime" report in your GA4 property. Just open your own website in a new tab, and you should see your visit pop up in that report within a minute or two.
Essential First-Day Configurations
To avoid headaches later, there are a couple of settings you should tweak on day one to make sure your data is clean. The most important one is filtering out your own team's traffic. You don’t want your own visits to your site messing with your numbers.
Pro Tip: Dive into the GA4 settings under Admin > Data Streams > Configure tag settings > Define internal traffic. Here, you can create a rule to exclude traffic from specific IP addresses, like your office or home network. It’s a simple step that ensures the data you’re analyzing comes from actual potential customers, not your own staff.
This is especially critical when you consider the sheer scale of the internet. Google.com itself saw over 168.67 billion visits in 2023, and 83.64% of those came from mobile devices. This highlights just how many people are out there searching—you want to make sure you're tracking the right ones.
Turning Traffic Data Into Actionable Insights
Collecting all that data is one thing, but knowing what to do with it is where the real magic happens. Once you’ve got your website traffic tracking dialed in, you can start turning those raw numbers into smart business decisions. For most people, that journey starts by digging into a few key reports in Google Analytics 4.
Find Out Where Your Visitors Come From
Your first stop should always be the Traffic Acquisition report. It tells you, plain and simple, where your visitors are coming from. Think of it as a map of every road leading to your website—organic search, a specific social media campaign, or a referral link from another blog.
Building out those referral pathways is a huge win for sustainable growth. It's why so many smart marketers focus on how SEO backlinks drive consistent web traffic.
Actionable Insight: Look at the "Engaged sessions" column next to each traffic source. If you see that "Organic Search" has a 65% engagement rate but "Paid Social" has only 20%, it suggests that your SEO efforts are attracting a more relevant audience. This data empowers you to double down on your content strategy.
Decode What They Do When They Arrive
Next, you'll want to jump over to the Engagement > Pages and screens report. This is where you get to see what people actually do once they land on your site. It’s a goldmine for figuring out which pages are a hit with your audience and which ones are causing them to bounce immediately. The numbers here are direct feedback on your content and user experience.
Imagine you see that visitors clicking through from a Facebook ad are spending less than 10 seconds on your landing page. That's not just a statistic; it's a huge red flag. Practical Example: This tells you to check for a disconnect. Does the ad promise a 50% discount, but the landing page doesn't mention it? Does the ad show a blue dress, but the page features a red one? Aligning your ad creative and landing page copy is the immediate action to take.
Turning data into action means treating every metric as a clue. A high bounce rate isn't a failure; it's a puzzle asking you to figure out what your audience expected versus what they actually found.
Your analysis also needs to account for where your visitors are located. Traffic patterns can vary wildly across the globe, and that context is crucial. For instance, in many parts of the world, a mobile-first experience is non-negotiable. Even in the United States, where there's a more balanced split, mobile devices still account for about 45.49% of all online traffic. You can explore more of these global website statistics and trends to get a better handle on your own audience.
When you look at these reports together, you start to piece together the full story of your customer's journey. It makes it so much easier to spot the friction points and, more importantly, the hidden opportunities for improvement.
Mastering Mobile Traffic Analysis

Let's face it: a huge slice of your audience is visiting your site on their phone. Ignoring their experience is like closing up shop for half the day.
The way people browse, shop, and read on a small screen is fundamentally different from how they act on a desktop. This makes mobile traffic analysis a non-negotiable part of understanding your website's performance.
When you filter your analytics data by device type—mobile, desktop, and tablet—you can uncover entirely different user stories. You might discover that your desktop conversion rate is 4%, but your mobile conversion rate is only 0.5%. That's not just a statistic; it's a massive clue that your mobile experience is costing you sales.
Uncovering Mobile-Specific Insights
Diving into these device-specific reports helps you answer some critical questions. Do mobile visitors look at fewer pages per session? Do they spend less time on your key product pages? These metrics can shine a light on hidden friction points you never knew you had.
Imagine you run an e-commerce store. You notice mobile traffic to a top product page is high, but the conversion rate is practically zero. Actionable Insight: Go through the entire purchase process on your own phone. Is the "Add to Cart" button too small to tap easily? Does the checkout form require too much typing? Identifying these specific pain points allows you to create a targeted fix.
Your mobile traffic data isn't just a set of numbers; it's direct feedback from your users about what works—and what doesn't—on their preferred device. Acting on it is key to capturing sales you might otherwise lose.
Optimizing The Mobile User Experience
Once you've spotted these issues, you can take specific, data-guided actions to fix them. The goal is to make your site not just usable, but genuinely enjoyable on a smaller screen.
- Simplify Navigation Menus: A cluttered menu is a nightmare on mobile. Use a "hamburger" menu and prioritize the most important links.
- Optimize Image Sizes: Use tools like TinyPNG to compress images before uploading them. This drastically improves load time on mobile networks.
- Improve Button and Link Sizing: Follow Google's recommendation of making tap targets at least 48×48 pixels. This is especially critical for calls-to-action like "Buy Now" or "Sign Up."
The dominance of mobile browsing isn't a new trend, but it's more important than ever. Mobile devices now account for a staggering 64.35% of all global web traffic. You can get the full story on this massive shift in the latest mobile traffic research from Soax.com.
Your Top Traffic Tracking Questions, Answered
Jumping into website analytics always kicks up a few questions, especially when you’re getting your sea legs. Let's clear the air on some of the most common things marketers and business owners ask when they first start tracking website traffic.
How Soon Will I See Data After Installing Google Analytics?
You'll see data almost immediately. Check out your Realtime report in Google Analytics within minutes of getting the tracking code installed correctly. This is the fastest way to confirm your setup is live and capturing visits.
For the more detailed standard reports, like Traffic Acquisition and Engagement, give it about 24 to 48 hours. That's how long it typically takes for all the data to be fully processed and show up accurately.
Can I Track Traffic Without Using Cookies?
Absolutely. There are a couple of solid ways to go about this. Privacy-first analytics tools like Matomo or Fathom Analytics are designed from the ground up for cookieless tracking.
Google Analytics 4 also has a pretty smart feature called 'Consent Mode'. It cleverly adjusts how it collects data based on what your visitors allow. This means you can still get measurement data even from users who say "no thanks" to cookies, giving you a privacy-friendly way to understand your audience.
Key Takeaway: It's so important to get the difference between a 'user' and a 'session'. A 'user' is the actual person on your site. A 'session' is what they do during one of their visits. Nailing this distinction is the key to accurately measuring both your audience size and how engaged they are.
What Is The Difference Between Users And Sessions?
This trips a lot of people up, but it's simpler than it sounds and super important for good analysis.
- A user is one unique, individual person who comes to your website.
- A session represents a single period of activity from that person.
Practical Example: If you read a news site on your phone in the morning and then browse it again on your laptop that night, you are one user who just created two separate sessions. Keeping an eye on both metrics shows you not just how many people are visiting, but how frequently they keep coming back for more.
Ready to turn your traffic insights into real growth? The team at Website Services-Kansas City specializes in professional website development and SEO to help your business thrive. Visit us at https://websiteservices.io to get started.